
 Location :
 The research team of Professor Anna Wang Roe and Jiaming Hu has recently published an article entitled "Spatial frequency representation in V2 and V4 of Macaque monkey" online in the internationally renowned journal eLife on Jan 6, 2023. This research revealed how spatial frequenciesare encoded and coordinated with other features in V2 and V4 of Macaque monkey.
Spatial frequency (SF) is an important attribute in the visual scene and is a defining feature of visual processing channels. Previous studies have shown that the organization of SF selectivity is related to orientation and color maps in the primary visual cortex (V1) and have a high degree of periodicity in both cats and monkeys. Studies have consistently shown an orthogonal mapping of SF and orientation, suggesting an efficient arrangement that provides each orientation access to a wide range of SFs. In contrast, color representation in V1 (the color is represented in patches commonly referred to as 'blobs' in V1) is generally associated with a range of lower SFs. Thus, in addition to a gradient from high to low of SF representation across eccentricities, SF organization is further specified within local distinct functional regions. This systematic architecture in V1 suggests that SF may be a fundamental feature of the cortical ‘hypercolumn’ (see Figure 1).
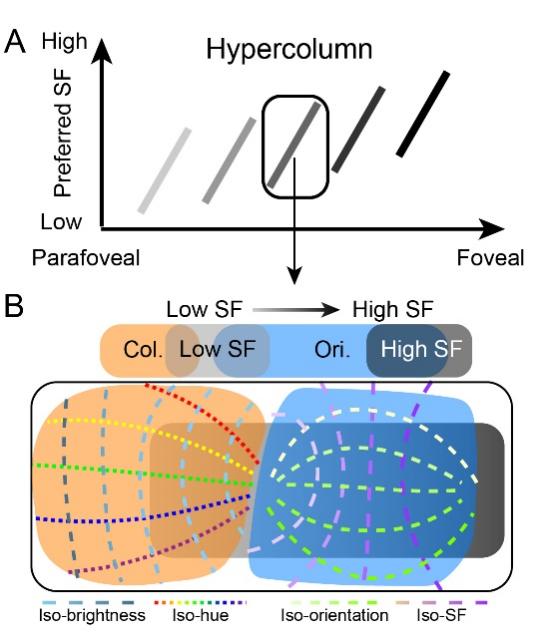
Figure 1. Illustration of proposed hypercolumn (including spatial frequency [SF], color, and orientation domains) in the visual cortex.
As eccentricity decreases from parafoveal to foveal region, the preferred SF gradually increases (represented as the brightness of the short bar).
(B) Details of structure in a single hypercolumn. In this local region, color domains (orange area) and orientation domains (blue area) exhibit different relationships with SF domains (light gray region: low SF preference domain; dark gray region: high SF preference domain). Orientation maps orthogonally to SF maps (green dashed lines: iso-orientation contours; purple dashed lines: iso-SF contours); an extensive range of SFs are available to each orientation. In comparison, color domains tend to have more spatial overlap with low SF preference domains and avoid overlap with high SF preference domains. In color domains, another orthogonal relationship exists between hue (dotted lines with different colors: iso-hue contours) and brightness (blue dashed lines: iso-brightness contours).
However, there remain many unsolved questions about how extrastriate areas in primate visual cortex code this fundamental information. Whether there are systematic associations between SF and other parameters in extrastriate areas, such as V2 and V4, is not known. Based on previous results reported in V1, the team predicted that in each area (1) the range of SF associations shift with the topographic location of the ‘hypercolumn’ (Figure 1A), (2) orientation-selective regions have a range of low (light gray) to high (dark gray) SF representation; iso-SF contours (purple dashed lines) map orthogonally to iso-orientation contours (green dashed lines), and (3) color-selective regions exhibit an association with a range of low SFs (light gray, Figure 1B).
To address this proposal, they imaged V2 and V4 of macaque monkey via intrinsic signal optical imaging (ISOI) with large cortical fields of view that contained sufficient territory to allow comparisons of functional organization at a range of eccentricities.

Figure 2. Experimental parameters.(A) Visual stimuli. (B) Diagram of imaging site in the right hemisphere. L: lateral; A: anterior. (C) Lower-left visual field. Black dot: fovea. Horizontal (red) and vertical (blue) lines mapped in (D). (D) Schematic mapping of lines in (C) in V4 (corresponding to the orange disc in B).

Figure 3. Two examples of overall spatial frequency (SF) preference in visual cortex.
(A, E) Blood vessel map of the imaged region for cases 1 and 2, respectively. (B, F) SF preference maps for cases 1 and 2, respectively. Different colors represent different SF preferences (see color bar at top). (C, G) The coverage ratio of SF preference in each visual cortical area (light gray: V1; medium gray: V2; black: V4). (D, H) Mean ± SD for the preferred SF of all pixels across V1, V2, and V4. ***Kolmogorov–Smirnov test, p<0.001.
Firstly, they compared the responses to different SFs (see Figure 2) among different cortical areas. They found that most of the imaged V1 region favored high SF stimuli, while most of the imaged V4 region favored low SF stimuli.The preferred SFs significantly decrease from V1 to V4, consistent with previous findings (see Figure 3).
The large-scale imaging makes it possible to capture highly structured maps of functional domainsand reveal changes to those maps for different SF conditions (see Figure 4). They found thatindependent of the type of visual information presented (orientation or color), parafoveal regions tend to process the visual input containing relatively low SF components, while visual input containing high SF components is better processed in foveal regions (see Figure 5). In V4, the foveal region is capable of processing visual information with a broad range of SF sensitivity (see Figure 4A, B). The results also show that, when only a few SFs are tested, the coverage ratio of the orientation and color domains is underestimated, underscoring the importance of testing a wide range of SFs.

Figure 4. Comparison of the functional maps obtained at different spatial frequencies (SFs).
(A, B) Combined results generated by superimposing pixels in (D) and (E), respectively. (C) Selective activation centers of the activated orientation domains (blue dots) and color domains (orange dots) under different SF conditions. (D) V4 orientation (45° vs. 135°) maps and corresponding activated regions for different SFs. (E) Color maps and corresponding activated regions for different SFs, acquired from the same case in panel (A). (F, G) Activated area histograms along the M-L axis generated from (D) and (E), respectively.
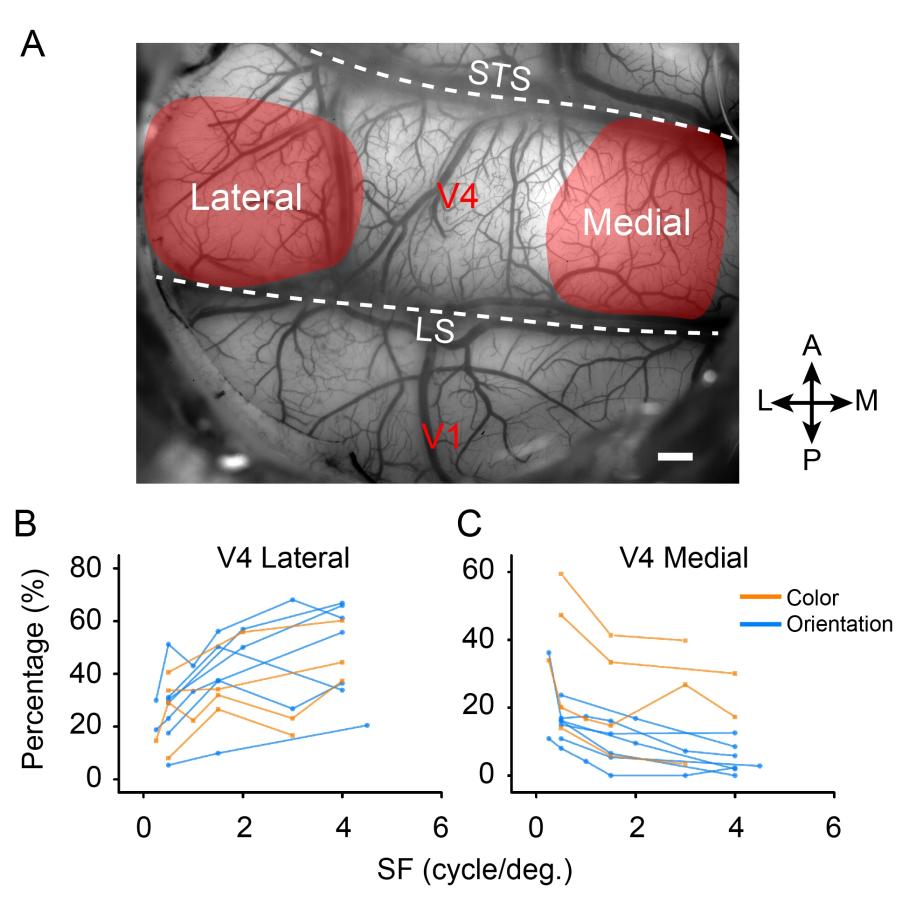
Figure 5. The percentage of selectively activated domains change according to spatial frequency (SF).
(A) Demonstration of cortical blood vessel map and the visual areas chosen for analysis. (B, C) The proportions of activated functional domains in the lateral and medial parts of V4 (color: orange, from four experiments in three hemispheres; orientation: blue, from seven experiments in five hemispheres) change according to SFs.
Having obtained orientation and SF preference maps from the same cortical region, it becomes possible to analyze the spatial relationships between these maps. They found thatin V2 and V4, the iso-orientation and iso-SF contours that intersected at large angles (>60 degrees) were found most frequently (see Figure 6).

Figure 6. Relationship between spatial frequency (SF) and orientation maps in V4 and V2.
(A) Orientation preference map. (B) Orientation selectivity map. (C) Selectivity thresholded orientation preference map (combined result from A and B). (D, H, L, Q, T) Iso-orientation (red lines) and Iso-SF gradient contours (blue lines). (E, I, M, P, S) Selectivity thresholded orientation preference maps corresponding to (D, H, L, Q, T). (F, J, N) Regions (white parts) with high orientation selectivity (normalized orientation selectivity > 0.5) selected for calculating the intersection angle. (G, K, O, R, U) Distributions of intersection angles of the selected regions. (V) Percentage comparison (Wilcoxon rank-sum test) among different angle groups (0–30°, 30–60°, and 60–90° of strong orientation-selective regions, n=15, and 60–90° of weak orientation-selective regions: 60–90° [“Ref.”], n=6). Error bar: SD. Scale bars: 1 mm.
Finally, theycompared the spatial relationship of color domains with SF domains. They found a great tendency for low SF domains to overlap with color domains in both V2 and V4. In V2, similar to color preference, SF preference vary along the V1/V2 border periodically (see Figure 7).
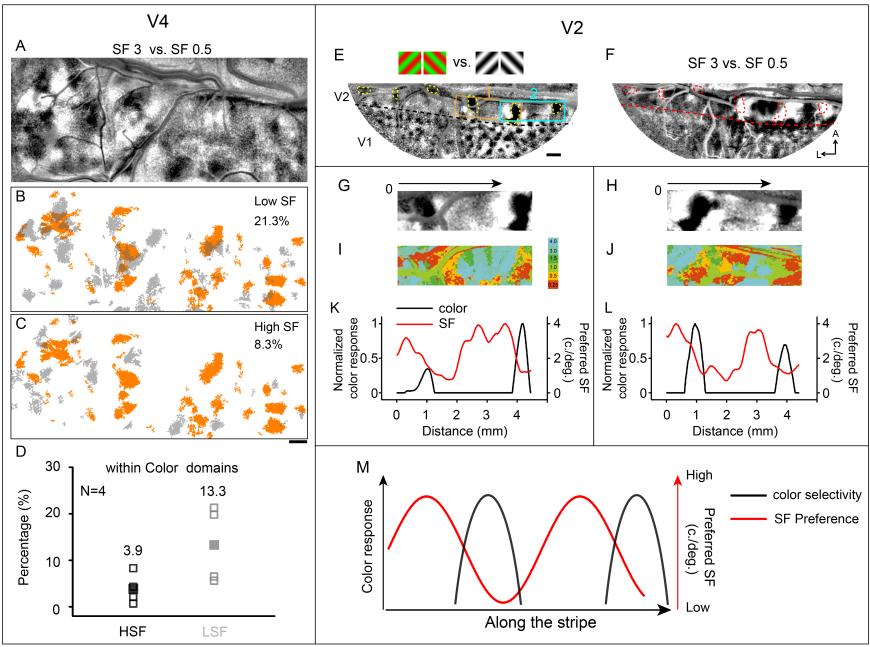
Figure 7. Relationship between spatial frequency (SF) and color-selective domains.
(A–D) Relationship in V4 that high SF domains tend to avoid color domains. (A) Differential SF map. (B, C) Overlay of color domains (orange) and SF domains (gray). (B) Low SF domains; (C) high SF domains. Scale bar, 1 mm. (D) The percentage of HSF/LSF (high spatial frequency/low spatial frequency) selectivity regions within color domains was calculated. (E–M) Relationship in V2 that stripe-like distribution of SF preference changes periodically. (E) Color map.(F) Differential SF maps. (G, H) Enlarged color maps from regions 1 and 2. (I, J) Enlarged SF maps from regions 1 and 2. (K, L) Changes of color-selective response (black lines) and SF preference (red lines) along the path parallel to V1/V2 border in V2. (M) Similar to color selective responses in V2, SF preference changes along V1/V2 border.
In summary, this study shows that in orientation regions, low to high SF is mapped orthogonally to orientation; in color regions, which are reported to contain orthogonal axes of color and lightness, low SFs tend to be represented more frequently than high SFs. This supports a population-based SF fluctuation related to the ‘color/orientation’ organizations. Based on these results, Roe and Hu propose a generalized hypercolumn model across cortical areas, comprised of two orthogonal parameters with additional parameters. They suggest the architecture of SF representation, which describes distinct SF representations within orientation and color regions, further extends and supports the view of continued parallel streaming of feature-specific pathways.
This research was conducted at Zhejiang University and was supported by the China Brain Initiative (grant no. 2021ZD0200401 to AWR), National Key R&D Program of China (grant no. 2018YFA0701400 to AWR), the National Natural Science Foundation of China (grant nos. 31627802, U20A20221, and 81961128029 to AWR; grant no. 32100802 to JMH), China Postdoctoral Science Foundation (grant no. 2020M681829 to JMH), and the MOE Frontier Science Center for Brain Science & Brain-Machine Integration, Zhejiang University. Zhang Ying is the first author. Prof. Roe, PI Hu and Prof. Schriver are the corresponding authors.